
Comptroller Kevin Lembo Archive > News
COMPTROLLER LEMBO PROJECTS $164.9-MILLION DEFICIT FOR FISCAL YEAR 2015Comptroller Kevin Lembo announced today that the state is on track to end Fiscal Year 2015 with a $164.9-million deficit.
In a letter to Gov. Dannel P. Malloy, Lembo said he is in general agreement with the Office of Policy and Management's (OPM) latest deficit estimate, which grew $3.2 million over last month's projection.
"This month, a significant downward adjustment of $35 million was made to oil company tax revenue within the General Fund," Lembo reported. "Retail gasoline sales receipts have fallen by more than 20 percent over the past several months due to a series of rapid declines in oil prices. The depressed price level is now expected to impact oil company tax collections for the remaining months of Fiscal Year 2015.
"The decline in the oil tax was partially offset by a $20 million gain in tax refunds. The refunds, primarily in non-income tax related areas, have averaged less than initial budget estimates. Other adjustments to the General Fund revenue netted to a decline of $8.7 million."
Lembo said that, while the General Fund experienced a net downward revenue adjustment of $24.3 million this month, projected General Fund spending was lowered by a net $21.2 million, primarily from a $26 million adjustment to anticipated deficiency requirements for the Department of Social Services.
General Fund revenue this fiscal year is projected to fall $190.4 million short of original budget projections - the largest shortfalls are in federal grants (-$73.5 million), the health provider tax (-$68.1 million) and the income tax (-$65.5 million). The most significant revenue gains are in the sales tax ($53.8 million) and the corporation tax ($51.7 million).
Lembo said OPM's projection anticipates that active budget management will result in General Fund spending falling $25 million below the original budget plan with a lapse (savings) estimate of $282.1 million.
"This savings target is well within the range of savings experienced over the past five fiscal years," Lembo said. "Over those five fiscal years, annual realized lapses have averaged $511.2 million.
"As I have been reporting, the state's overall economic climate has been gradually improving."
Lembo pointed to preliminary figures showing that Connecticut gained 1,200 payroll positions in April - and 23,200 jobs over the past 12-month period. Average hour earnings were up 75 cents, or 2.7 percent, from the April 2014 estimate. Average private-sector weekly pay was 2.4 percent higher than a year ago. Wage growth was exceeding 6 percent as the state entered the 2008 recession and has exhibited an erratic pattern in the post-recession period.
Lembo said a report from the Warren Group released May 5 shows that single-family home sales rose 11 percent in March from the same month last year - the strongest March sales number in five years. Home prices also rose 3 percent in March from $225,000 to $232,000.
However, included below are additional details about diminished homeownership rates that deserve consideration, Lembo said.
Lembo pointed to the latest economic indicators from federal and state Departments of Labor and other sources that show:

-
Through the first 10 months of Fiscal Year 2015, the year-to-date withholding portion of the income tax was running 3.7 percent above the same period last year. For most of Fiscal Year 2015, withholding receipts have been running close to the gains experienced in the prior fiscal year.
-
Withholding receipts have yet to attain pre-recession growth rates. The large revenue increases in Fiscal Years 2011 and 2012 were almost entirely attributable to higher income tax rates. Net of those tax increases, withholding receipts were stagnant in both Fiscal Years 2011 and 2012. The poor performance also continued through Fiscal Year 2013. In Fiscal Year 2015, despite improving employment statistics, the withholding tax has yet to establish a pattern of consistent accelerating growth.

-
According to the Department of Labor, preliminary figures show that Connecticut gained 1,200 payroll positions in April. Connecticut has gained 23,200 jobs over the past twelve-month period. Over the entire calendar 2014 year, the state added 25,100 payroll positions.

-
Connecticut has now recovered 93,200 positions, or 78.3 percent of the 119,000 seasonally adjusted total nonfarm jobs that were lost in the state during the March 2008 - February 2010 employment recession. Connecticut's jobs recovery is in its 62nd month. The private sector has recovered employment at a better pace and has now replenished 98,300 (88.1percent). The state needs to reach the 1,713,000 level to reach a clear nonfarm employment recovery; April's total employment number was 1,687,200. So, based on the present employment trend, it will require another 12 months to hit that recovery level.
-
The table below shows the distribution of employment gains and losses by major employment sector over the latest 12-month period ending in April.

-
U.S. employment has been advancing at a rate of 2.2 percent over the 12-month period ending in April; Connecticut's employment growth was 1.4 percent for the same period.
-
Connecticut's unemployment rate was 6.3 percent in April; the national unemployment rate was 5.4 percent. Connecticut's unemployment rate has continued to decline from a high of 9.5 percent in October 2010.
-
There are approximately 120,100 unemployed workers in Connecticut. A low of 36,500 unemployed workers was recorded in October of 2000. The number of unemployed state workers hit a recessionary high of 177,200 in December of 2010.
![]()
-
The Department of Labor reports that average hourly earnings at $28.73, not seasonally adjusted, were up 75 cents, or 2.7 percent, from the April 2014 estimate. The resultant average private sector weekly pay was calculated at $962.46, up $22.33, or 2.4 percent higher than a year ago.
-
The graph below shows the year-over-year percent change in hourly wages in Connecticut. Wage growth was exceeding 6 percent as the state entered the recession and has exhibited an erratic pattern in the post-recession period.

-
Economists expected wage growth to post steady increases as employment stabilized. Although employment gains have been strengthening, the wage pattern in both Connecticut and nationally has been far more erratic than expected. This trend has placed significant downward pressure on revenue collections and overall economic growth.
-
The 12-month percent change in the Consumer Price Index for All Urban Consumers (CPI-U, U.S. City Average, not seasonally adjusted) in April 2015 was -0.2 percent (still deflating).
-
Based on data released by the Bureau of Economic Analysis on March 25 for calendar year 2014, personal income in Connecticut grew at a rate of 3 percent between 2013 and 2014; however, annualized growth for the 4th quarter was just over 4 percent. Connecticut was ranked 39th nationally in personal income growth in 2014, but ranked 22nd in 4th quarter income growth. Results for the 1st quarter of 2015 will be released on June 22.
-
The chart below shows the annual trend in Connecticut personal income over time, which is well off the pace set during the last post-recessionary period.


-
The Real Estate Conveyance Tax is trending close to last year's receipt level through April.
-
According to a report from the Warren Group released on May 5, Connecticut single-family home sales rose 11 percent in March from the same month last year. This is the strongest March sales number in five years. Adding to the positive sales news, home prices rose 3 percent in March from $225,000 to $232,000. The state has experienced sales increases in six of the last seven months. However, median home prices have been stagnant or declining over the past several years. The only year of the last four that posted a price gain was 2013.
-
There has been a significant shift in homeownership rates nationally and in Connecticut over the past 25 years. The US homeownership rate rose to a high of more than 69% during the housing boom in the mid-2000s and has now fallen to 63.7%. While home ownership rates in Connecticut are higher than the national numbers, the downward trend in homeownership is similar to the US experience.

-
At the same time, renting is near an all-time high, as younger Americans stay in such housing longer than historical norms, older Americans downsize into rentals and the millions who lost their homes to foreclosure during the housing crash now rent.
-
There is also an expanded availability of single-family rental homes, which is the outgrowth of investors rushing into the housing market as the recession unfolded to take advantage of historically low mortgage rates and falling home prices.
-
The influx of single-family home rental units expanded the options available to renters, especially those with families who want to live in good school districts. Now, as home prices rise again, none of these renters are experiencing the attendant wealth growth; instead renters are seeing increases in monthly rent charges-a drain on wealth accumulation.
-
Nationally, from 2000 to 2013 homeowners gained more than $50,000 in household wealth on average as home prices rose. Renters, who were likely already on the lower-income side, saw none of those gains.
-
Home equity has historically been a catalyst to consumer spending. Consumer spending accounts for about three-quarters of the nation's Gross Domestic Product. So fewer consumers participating in housing equity gains is likely contributing to slower overall economic growth.
Consumers
-
Sales tax receipts through April of Fiscal Year 2015 were up 3.3 percent over last year. The sales tax is on track to complete the year almost $53.8 million above the original budget estimate.
-
Advance retail sales were up 0.9 percent in April from the same month last year. For the 1st quarter of 2015 sales were advancing at a 2.2-percent rate. Food services and drinking places had the strongest gain at 8.5 percent followed by non-retail stores at 2.3 percent. Auto sales were down from earlier in the year growing 5.1 percent. Gasoline stations posted the largest sales decline at -22 percent due to lower prices. Department stores also experienced a decrease in sales.
-
The Conference Board's consumer confidence index increased slightly in May following a steep April decline. Consumers were mixed in their assessment of the job market. Those stating jobs are "plentiful" increased from 19.0 percent to 20.7 percent, while those claiming jobs are "hard to get" rose from 25.9 percent to 27.3 percent. Consumers remain extremely cautious with respect to the overall economic performance.
-
The Federal Reserve reported that March consumer credit increased at a seasonally adjusted annual rate of 7.4 percent. This is acceleration in credit demand from the first two months of 2015. Revolving credit, primarily credit cards, increased at an annual rate of 5.9 percent, while non-revolving credit, which includes auto loans and student loans, increased at an annual rate of 7.9 percent. The change in revolving credit had been negative during the first two months of the year, so March represents a significant improvement.
Business and Economic Growth
-
Based on the May 29 second estimate by the Bureau of Economic Analysis, real GDP decreased at a rate of 0.7 percent in the 1st quarter of 2015. In the 4th quarter of 2014 real GDP increased at a 2.2-percent rate. The next update to the 1st quarter numbers will be released on June 24.
-
The downturn in the percent change in real GDP primarily reflected a deceleration in personal consumption expenditures and downturns in exports, in nonresidential fixed investment, and in state and local government spending that were partly offset by a deceleration in imports and upturns in federal government spending and in private inventory investment.
-
Corporate profits were down slightly in 2014. After gains in the 2nd and 3rd quarters of 2014, profits fell in the 4th quarter. The 1st quarter of 2015 also posted a decline from the preceding quarter; however, profits were running 3.7 percent above the same period one year ago.
-
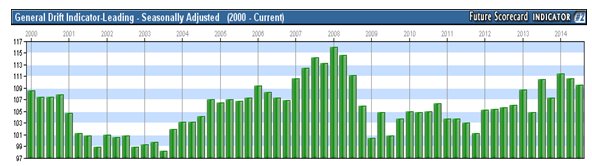
The Department of Labor's General Drift Indicators are composite measures of the four-quarter change in three coincident (Connecticut Manufacturing Production Index, nonfarm employment, and real personal income) and four leading (housing permits, manufacturing average weekly hours, Hartford help-wanted advertising, and initial unemployment claims) economic variables, and are indexed so 1986 = 100. The index has been showing a general upward trend although it remains well below pre-recession levels.
Stock Market
-
Estimated income tax payments, which are influenced by capital gains receipts, were trending 6.1 percent higher on a year-to-date basis thru April from the same period one year ago. The chart below shows the trends in estimated and final income tax payments since 2005.
-
The final payment portion of the income tax was growing at a year-to-date rate of 11.3 percent through April as compared to the same period last year. This was under budget expectations and resulted in a downward adjustment in the income tax estimate of $65.5 million from the initial budget projection.

-
Over the past 12 months, the Dow has posted a gain of 8.9 percent with significant monthly swings

-
As a result of the monthly volatility, the Dow gain on a year-to-date basis has been under 2 percent.

***END***