
Comptroller Kevin Lembo Archive > News
COMPTROLLER LEMBO REPORTS FINAL $248 MILLION SURPLUS FOR FY 14PROJECTS $300,000 SURPLUS FOR FY 15
Lembo also announced this week a final pre-audited surplus of $248 million for Fiscal Year 2014 that will be entirely deposited into the Budget Reserve Fund, or "Rainy Day Fund" as Lembo has recommended. A final annual audited report will be completed by year's end.
In letters to Gov. Dannel P. Malloy, Lembo noted that it remains very early
in the current fiscal year, but spending is expected to grow modestly, by only 2
percent, while revenue is expected to grow approximately 2.6 percent.
"These budget targets will be influenced by changes in economic conditions as
the fiscal year progresses," Lembo said. "In future months I will detail changes
in existing projections. The state's economy continues to post moderate monthly
growth."
Lembo noted that his office, along with the Office of Policy and Management (OPM)
and the State Treasurer, will also continue to monitor the status of certain
federal Medicaid reimbursements anticipated this year that have been partially
deferred pending a review of claim methodology by the Department of Social
Services (DSS) and the federal Centers for Medicare & Medicaid Services.
"I will continue to carefully monitor the federal reimbursement issue and will
report on any change in the current situation and the potential budgetary
impact," Lembo said.
Lembo highlighted state and national economic indicators from federal and state
Departments of Labor and other sources that show:

-
Annual gains in the employment-driven withholding portion of the state income tax increased 3.9 percent in Fiscal Year 2014 as compared to the prior fiscal year.
-
Connecticut job gains became more consistent in the second half of Fiscal Year 2014, lifting the withholding tax to its highest percentage increase since the recession ended. But the gain was still well below pre-recession levels.
-
The large revenue increases in Fiscal Years 2011 and 2012 were almost entirely attributable to higher tax rates. Net of those tax increases, withholding receipts were stagnant in both Fiscal Year 2011 and Fiscal Year 2012. That stagnation also continued through Fiscal Year 2013.
-
Year-to-date receipts in August of Fiscal Year 2015 were increasing at a 2.8-percent rate over the same period one year ago.

-
The graph below depicts the stabilization of job growth in Connecticut going into the second half of Fiscal Year 2014. After six months of consecutive job gains, the state lost 3,600 jobs in August. This is a one month reversal based on preliminary numbers.

-
August employment results were also disappointing nationally, after remaining at or above 200,000 job addition levels each month, August job gains fell to 142,000 based on preliminary results.

-
The state has been averaging 1,322 job additions a month since the recovery began. This is about 4% below the rate of job additions after the 2001 recession.
-
According to the Department of Labor, Connecticut has now recovered 71,400 positions, or 59.9% of the 119,100 seasonally adjusted total nonfarm jobs that were lost in the state during the March 2008 - February 2010 recession. The core private sector has brought back employment at a faster clip and has now recovered 83,900 (74.9%) of the 112,000 private sector jobs that were lost during the same recessionary downturn. At 1,665,300 nonfarm jobs for August 2014, the state needs to reach the 1,713,000 level to start a true nonfarm employment expansion. This will require an additional 47,700 jobs going forward. A total of 28,100 additional private sector positions are needed to have a fully restored private sector. The government supersector, which also includes tribal casino employment, has continued to lose employment (-12,500 positions) since the overall recovery began in February 2010.
-
The table below shows the distribution of employment gains and losses by major employment sector over the latest 12-month period ending in June.
- Job additions in Connecticut during this period total 5,600.
| Job Gains Latest 12 months | Job Losses Latest 12 months | ||
|---|---|---|---|
| Sector | Sector | ||
| Transp. & Public Utility | 4,400 | Government | -7,400 |
| Leisure & Hospitality | 3,100 | Prof & Business Serv. | -1,400 |
| Construction | 3,000 | Information | -700 |
| Education & Health | 2,800 | Financial Activities | -300 |
| Other Services | 1,500 | ||
| Manufacturing | 600 |
-
Through August, Connecticut has been adding jobs at an annual rate of 0.3 percent; the growth number nationally is 1.8 percent.
-
Connecticut's unemployment remained at 6.6 percent in August; the national unemployment rate was 6.1 percent. Connecticut¡¦s unemployment rate has continued to decline from a high of 9.5 percent in October 2010.
-
There are approximately 123,500 unemployed workers in Connecticut. A low of 36,500 unemployed workers was recorded in October of 2000. The number of unemployed state workers hit a recessionary high of 181,300.

-
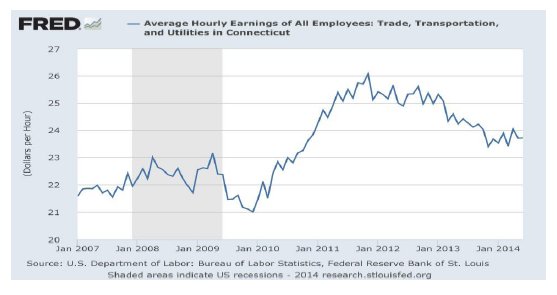
The Department of Labor calculates that Connecticut's average hourly earnings rose a modest 0.11 percent over August of 2013. Average private weekly pay rose to $944.37, up $10.63, or 1.1 percent over the year.
-
Average hourly earnings of private sector workers have struggled to establish a consistent growth trend over the last two years.

-
Connecticut is not alone in experiencing sluggish wage growth. A report issued by the United States Conference of Mayors in August found that jobs added after the recession on average pay 23 percent less than the jobs lost during the recession.
-
At the same time, the nation's high-income workers have accumulated wealth at a faster rate than middle to low income workers. From 2005 to 2012, the top 20 percent of earners were responsible for more than 60 percent of all income gains in the country according to the report. By contrast, the bottom 40 percent saw only 6.6 percent of the increases. But a study by Emanuel Saez, an economist from the University of California, Berkeley found that even the top earners were experiencing wage growth below the levels attained in the last two economic expansions.
-
These patterns are seen in Connecticut specific data. The Transportation and Public Utilities sector with the largest state job additions over the past twelve months has experienced persistent wage declines; whereas the Professional and Business Services sector with the largest non-government job decline over the last twelve months has experienced a general upward trend in wages.

-
Declining wages have been a continuing national concern because of their impact on the consumer driven U.S economy. Over the past four decades, even during economic expansions, wage gains have not kept pace with economic growth. Wages and salaries peaked at more than 51 percent of the economy in the late 1960s; they fell to 45 percent by the start of the last recession in 2007 and have since fallen to 42 percent.
-

-
-
Average hourly earnings of private sector workers have struggled to establish a consistent growth trend over the last two years.
-
The year-to-year change in the Consumer Price Index for All Urban Consumers (CPI-U, U.S. City Average), not seasonally adjusted, increased at a 1.7-percent rate in August.
-
Based on data released by the Bureau of Economic Analysis on September 30, personal income in Connecticut grew at an annualized rate of 5.2 percent in the 2nd quarter of 2014. This is the strongest rate of state income growth over the last 5 quarters. The strongest gain came from interest, dividends and rents.
The chart below shows the annual trend in Connecticut personal income
over time. The 2014 estimate is based on annualizing 2nd quarter results.


- For Fiscal Year 2014, The Real Estate Conveyance Tax exceeded budget expectations by $36.7 million or more than 25 percent of the projection. Gains have remained positive at the start of Fiscal Year 2015.
- According to a report from the Warren Group released on September 10, single-family home sales in Connecticut year-to-date thru July of 2014 fell 1.2 percent from the same period one year ago. Sales in the single month of July exceeded last July sales by less than 1 percent.
- Connecticut home sales volume has been moving in a positive direction since March of 2014. However, year-over-year, home prices fell 3.9 percent in July. The median sales price of a single-family home statewide dropped to $275,000 in July, down from $286,000 in July 2013. This marked the fifth consecutive month that median prices have decreased this year. The year-to-date median sales price was $255,000, down 2.7 percent from $262,000 during the same period last year.
- Connecticut condominium sales fell almost 5 percent in July from a year earlier. Year-to-date, condo sales were up almost 2 percent from a year earlier. The median sales price of condos decreased by 2.7% in July. The median selling price was $180,000, compared with $184,900 a year earlier. The year-to-date median price of condos in Connecticut was $169,900, down 0.06 percent from $170,000 a year ago.
-
The National Association of Realtors reported slowing U.S home sales in August. Existing home sales in August were down 5.3 percent from the same month last year; sales were down 1.8 percent in August from the prior month. Nationally, home prices grew by 4.8 percent from last August.
- Estimated payments in the last quarter of Fiscal Year 2014 were advancing
at a rate of just over 9 percent. Final September receipts, which are still
being calculated, will be the first significant deposit of quarterly
estimated payments in Fiscal Year 2015.
DOW
- At this writing the Dow Jones Industrial Average has posted a 12-month gain of 12.2 percent; however, on a calendar year to date basis the market has been less robust growing less than 4 percent.

Consumers
- August advance retail sales were up 5 percent from the same month last year. This is slightly higher than the 4.5-percent pace set for the prior three-month period.
- A consistent theme throughout 2014 has been solid automobile sales. Car sales advanced 9.5 percent in August from one year ago. Health and personal care establishments, building and garden supply stores, and non-store retailers posted the strongest August gains. Department stores posted declining year-over-year sales.
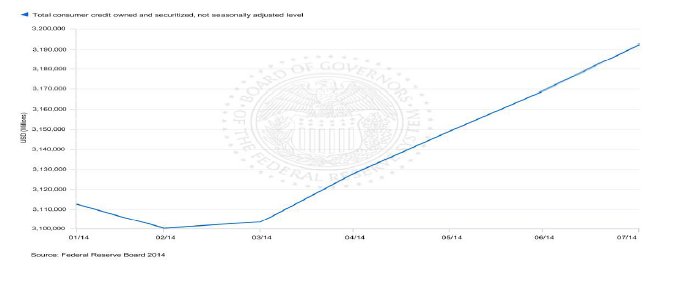
- Federal Reserve data shows that consumer credit has been expanding in
2014 at the strongest rates since the recession ended. Strong consumer
credit growth began in March and has been accelerating. Consumer credit
increased in July at a seasonally adjusted annual rate of 9.75 percent.
Revolving credit increased at an annual rate of 7.5 percent, while
non-revolving credit increased at an annual rate of 10.5 percent.
Business and Economic Growth
- Based on the September 26 release by the Bureau of Economic Analysis, real GDP increased at a rate of 4.6 percent in the 2nd quarter of 2014. In the 1st quarter of 2014 real GDP declined 2.1 percent.
- The increase in real GDP in the 2nd quarter primarily reflected positive contributions from personal consumption expenditures (PCE), exports, private inventory investment, nonresidential fixed investment, state and local government spending, and residential fixed investment. Imports, which are a subtraction in the calculation of GDP, increased.
- In the 2nd quarter, U.S. corporate profits posted an 8.4-percent gain from the 1st quarter, but profits advanced only 0.1 percent from the same quarter last year.
- The Department of Labor¡¦s General Drift Indicators are composite measures of the four-quarter change in three coincident (Connecticut Manufacturing Production
- The index, nonfarm employment, and real personal income) and four leading (housing permits, manufacturing average weekly hours, Hartford help-wanted advertising, and initial unemployment claims) economic variables, and are indexed so 1986 = 100.
- The index has been showing a general upward trend.

***END***